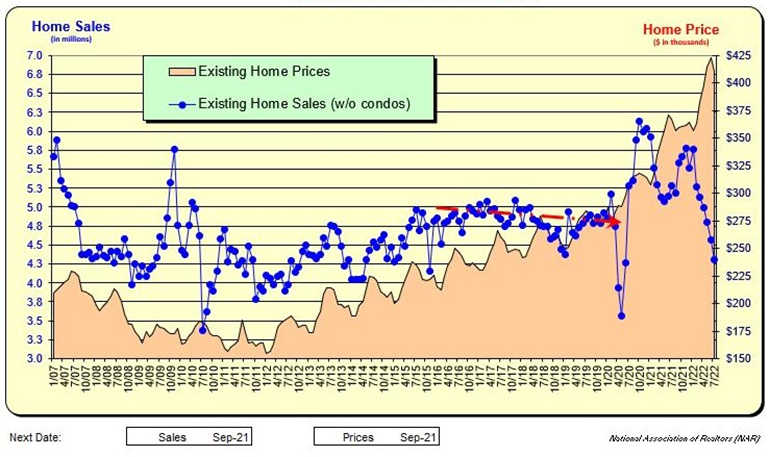
Existing Homes Sales continue to decline due to rising mortgage rates, higher home prices, and relatively few homes for sale. Record low-interest rates in 2020-’22 likely may have brought forward the demand to purchase in 2022 or 2023.
Historically, 75% of any home price appreciation for a calendar year will occur in the 2nd quarter. Home closings rise in the 3rd quarter.
The National Association of Realtors has a monthly report that is excellent. Key historical time series national data is shown on the attached file that includes:
- Sales
- Prices
- Months of Inventory
- Days on Market
- Pending Sales Index
- Regional Sales and Prices
- First-time home buyers
- Investors and All Cash Transactions
On the graphic below, prices are in the shaded area and have been increasing over time (in July they declined) while the number of homes sold has been steadily decreasing (blue line). The decline is due to home prices and mortgage rates increasing, along with an extremely low inventory of homes for sale.
Existing Home Sales and Prices
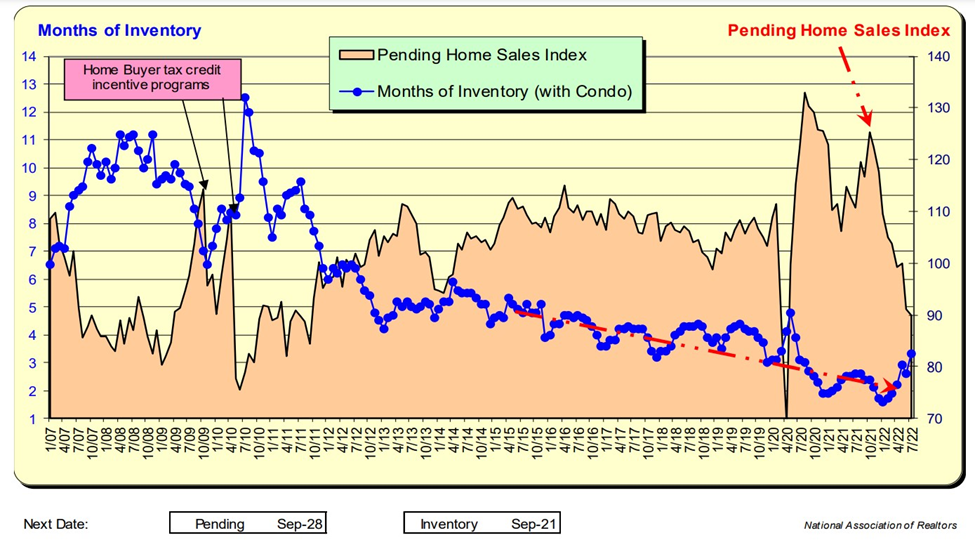
What does the future look like? Pending sales have been in a free fall but that appears to be slowing. One or two months don’t make a trend, but it could be a start.
The months of inventory are increasing. This is a combination of fewer recent sales (supply constrained, rising mortgage rates, and higher home prices). The fact it occurred in July and not later in the fall season may be cause for concern. Pending Home Sales Index has materially decreased over the past 8 months—initially due to a lack of homes for sale AND now rising mortgage rates and home prices. Record low-interest rates in 2020-’22 likely may have brought forward the demand to purchase in 2022 or 2023.
Existing Homes Supply For Sale and Pending Sale Index
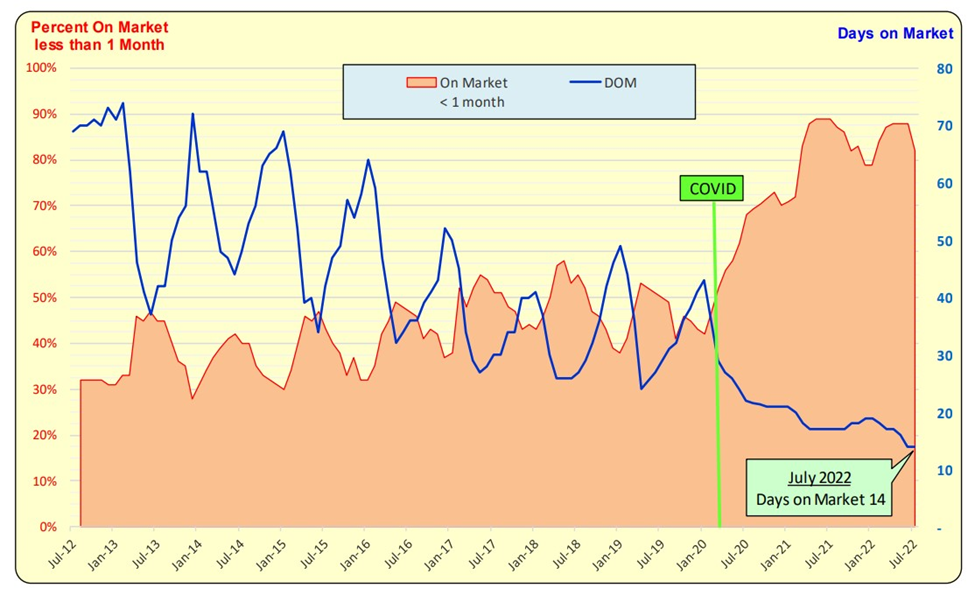
Prior to COVID-19, the Days on Market (DOM is the blue line) had been gradually decreasing. After COVID-19, the days on market reached record lows and are now 14 Days as of June 2022. 70% of all properties sell in ONE MONTH (red line).
Days on Market
Mortgage rates are now above 5.00% (red bars) and it is anticipated that this will have a dampening effect on home sales. (blue line). The rate increases in April-July will impact August+ closings. Home prices are the dashed green line and even with mortgage rates rising, home prices rose. This has occurred in the past when rates rose—-future near-term home buyers rushed into the market to buy before mortgage rates rose further.
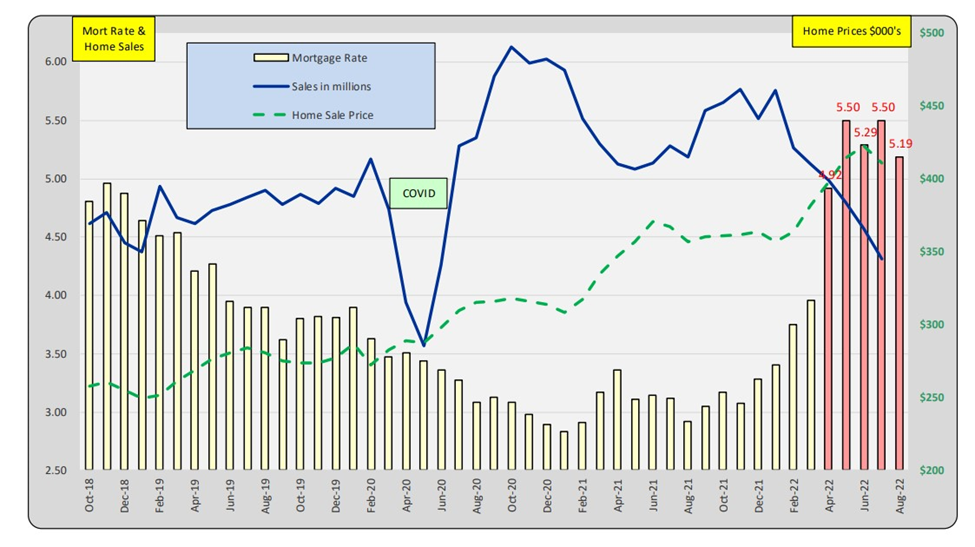
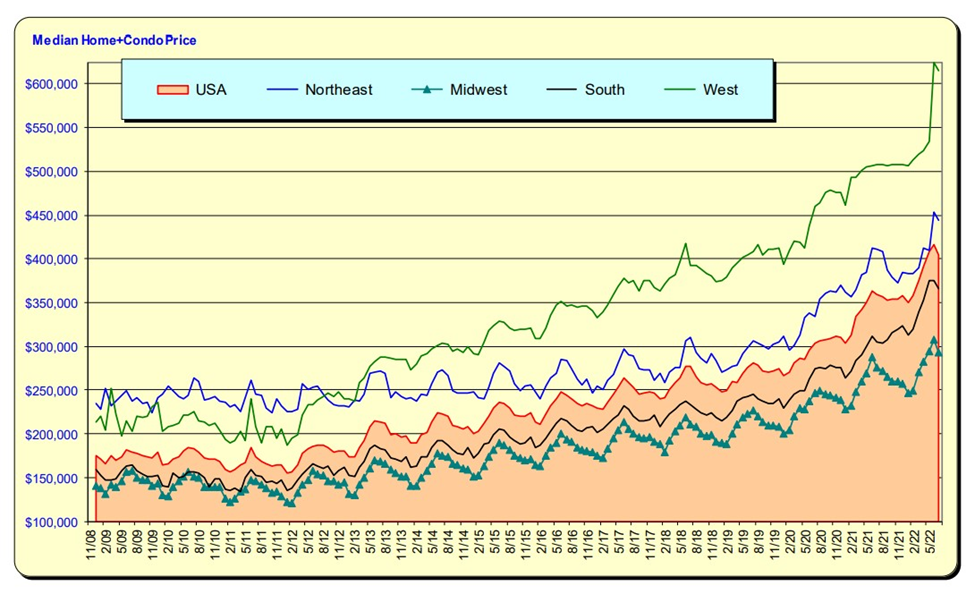
Median Home Plus Condo Price
Median home prices for all regions accelerated in early 2022 just as mortgage rates rose. It is noted there was a decline in July. This is normally a strong selling month. For the West—note the flat monthly prices prior to the sudden recent acceleration.
Bill Knudson, Research Analyst Landco ARESC
