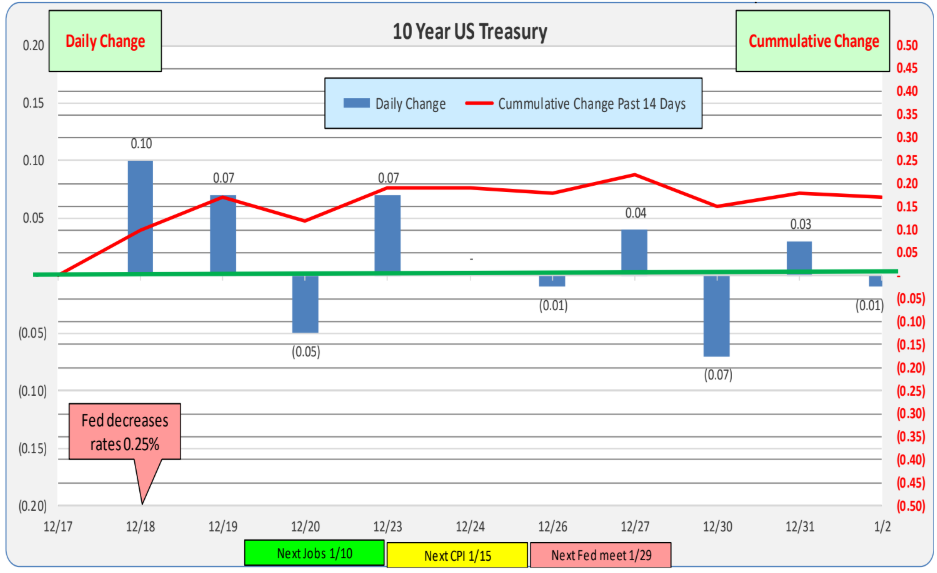
Over the past week, 10-Year Treasury rates decreased by 1bp. However, the net change over the past two weeks shows an increase of 17bp.
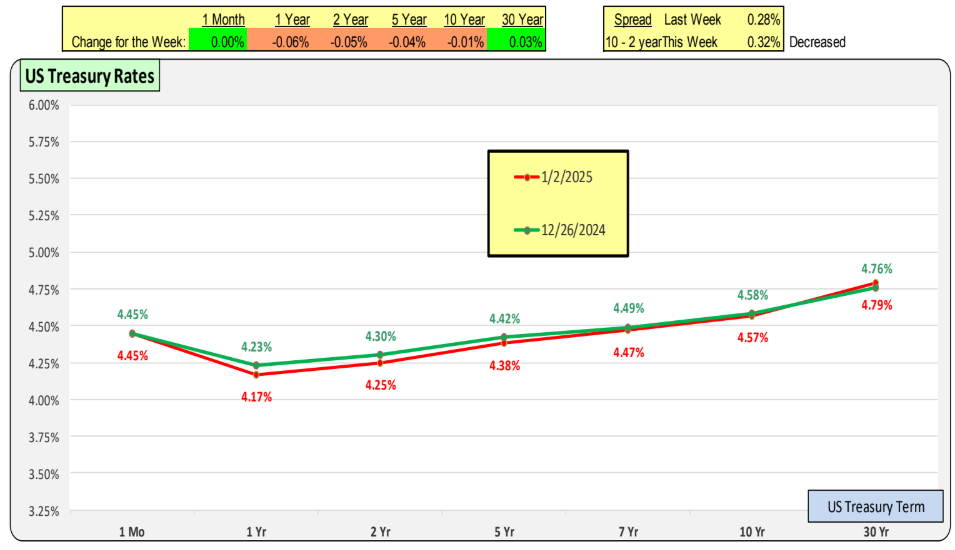
The red line in the chart represents current rates, while the green line indicates rates from one week ago. During this period, short-term rates decreased, while long-term rates increased.
For terms of 1+ years, the yield curve now exhibits a positive slope. As the Federal Reserve reduces its federal funds rate, short-term rates are expected to decrease further, gradually restoring the yield curve to a typical positive slope.
This positive yield curve is emerging due to a combination of the Federal Reserve’s short-term rate cuts and market dynamics driving demand for higher long-term rates.
Bill Knudson, Research Analyst LANDCO NEXA